Cost of Current Services - Separation Analysis
Updated 3/30/2021
Memorandum - March 29, 2021 (download PDF)
Memorandum & Examples - March 26, 2021 (download PDF)
Memorandum & Presentation - September 23, 2020 (download PDF of full presentation)
To: Town Selectboard; Village Trustees; Evan Teich, Unified Manager
From: Sarah Macy, Finance Director/Assistant Manager
Re: Analysis of Current Funding and Estimated Cost of Separation
Date: September 23, 2020
This information is designed to address the following:
1. How are the budgets of the Town and Village currently funded? Which portion is paid for
by Village taxpayers and which portion is paid for by Town Outside the Village (also
referred to as TOV throughout) taxpayers?
2. A side-by-side comparison by department.
3. What would it cost if the Village were to separate from the Town?
SEGMENT I: Currently, where does the money come from and where does it go? (download PDF)
I’ve started this analysis with the FY20 (July 1, 2019 – June 30, 2020) voter approved budgets. I
have taken those numbers from the 2019 annual report, added the $100,000 in the Town budget
that was added from the floor, and listed the expenses out by department in table 1. Readers of
this document should be able to tie these figures back to their annual report. Table 1 also eliminates
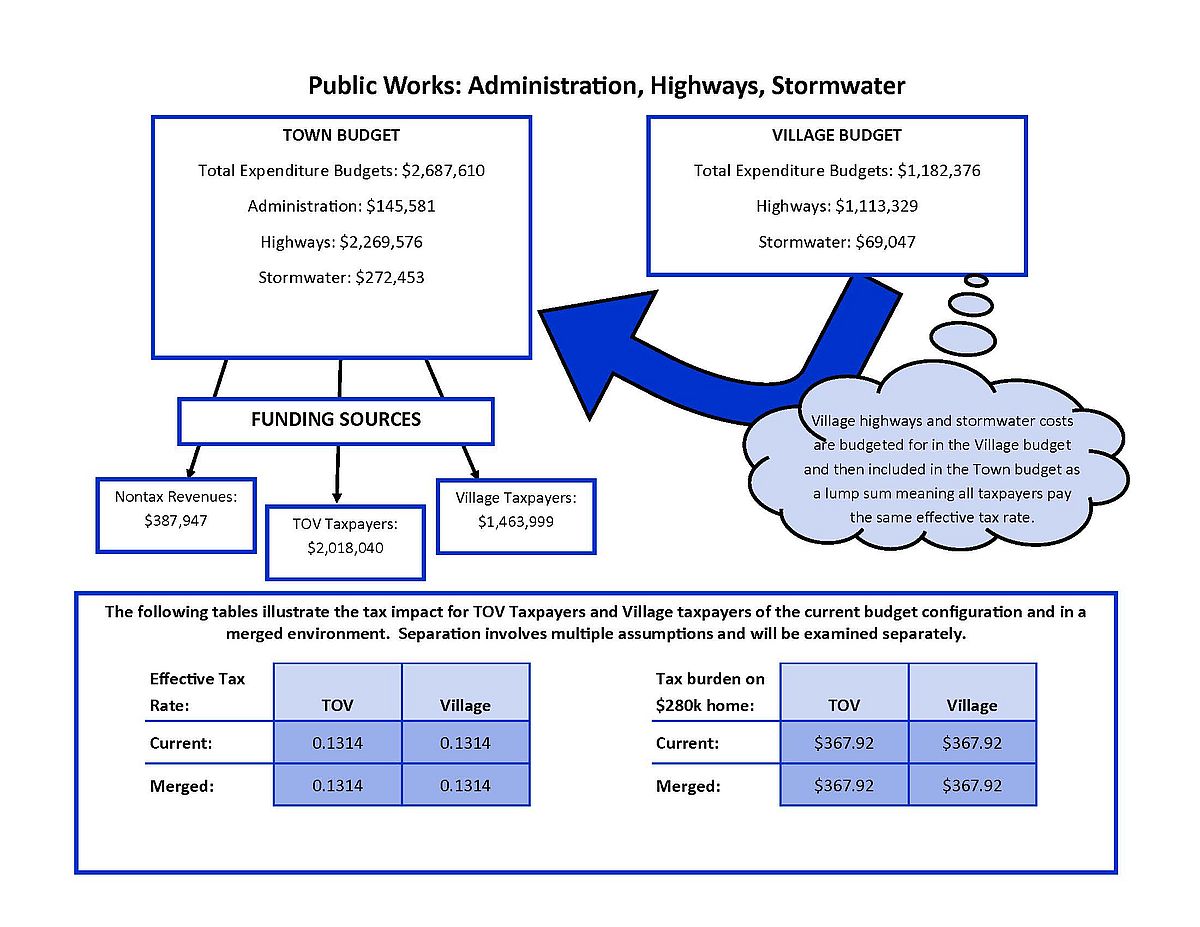
any item that appears in both expenditure budgets. Why would this happen? For example, Village
Highway and Stormwater are under the budgetary control of the Village, but through MOU with
the Town are funded through the Town budget so that all taxpayers pay the same effective
Highway and Stormwater tax rates. In practice this means, the Village figures show up in detail
in the Village budget, offset by a revenue transfer in from the Town, and then are included in the
Town budget as one line to access the Town tax levy funding. Eliminating the duplicate items
allows us to see the true expenditures of each budget as listed in the “Adjusted Total Amount”
column.
In addition to duplicated items, the Town and the Village differ in budgetary practices meaning
the budgets cannot be just put side by side and compared. A reconciliation is required to provide
a basis for consistent examination. Table 2 takes the adjusted total amount from table 1 and further
adjusts it through a reconciliation process that gets the two budgets aligned for easier comparison.
The footnotes in table 2 detail the reconciling items. An example is the way capital is funded. The
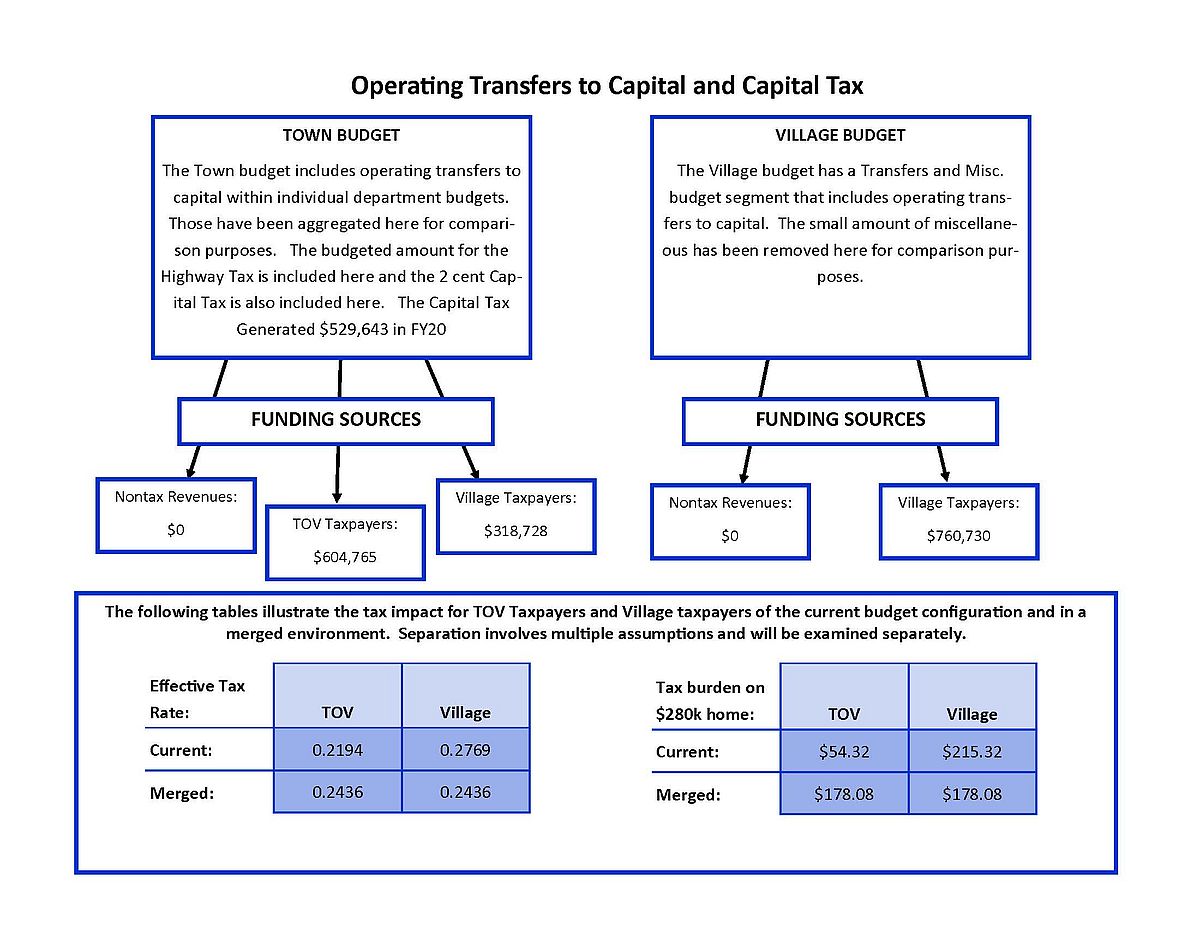
Town budget includes operating transfers to capital within various departments (in addition to
the 2 cent capital tax) and the Village budget has all operating transfers to capital in their own
budget segment. Reconciling the two budgets provides an “Adjusted and Reconciled Total
Amount” which we will use moving forward.
Now that we have two budgets on the same basis, it should be noted that a portion of the budgets
are funded with non-tax revenue sources. These may be grant funds, permits, charges for services,
etc. In table 3, the adjusted and reconciled total amount from table 2 is listed with all non-tax
revenue sources allocated to each department, leaving an adjusted net amount funded with taxes
2 for each budget segment. This is the dollar amount of the tax levy that is dedicated to each
segment.
From here in table 4a I have taken the adjusted net amount funded with taxes and started filtering
it back into the budget structure we are used to seeing which shows how these dollars show up in
the two budgets. Starting with table 4b, I have begun to answer the actual question – who pays
how much and for what. Table 4b uses the gross FY20 grand list and calculates out which portion
of the grand list (Village or TOV), pays how much for each segment. Next, table 5a takes the
information in table 4b and calculates an effective tax rate for each budget segment. Table 5b is
the same data as table 5a but listed alphabetically by budget segment to see a side by side analysis
of similar segments.
A note about the effective tax rate calculation – each of these tax rates is recalculated using the
adjusted net amount funded with taxes divided by the appropriate segment of the grand list. In
addition to rounding errors when working 4 digits past the decimal, the grand list figures used here
do not take into account tax stabilization agreements in the Town or the Village and are therefore
slightly higher than the grand list figures used when calculating the actual tax rates. I have also
included the budgeted dollars to be raised by the highway tax in the analysis which creates a
slightly lower effective highway tax rate than actual. This results in the recalculated rates being
slightly different from what the actual tax rates were in FY20. Although it is not material, it should
be noted for those trying to follow along and recalculate to their tax bill. The variance is 0.0014
or 0.27% on the Town rates and 0.0025 or 0.30% on the Village rates.
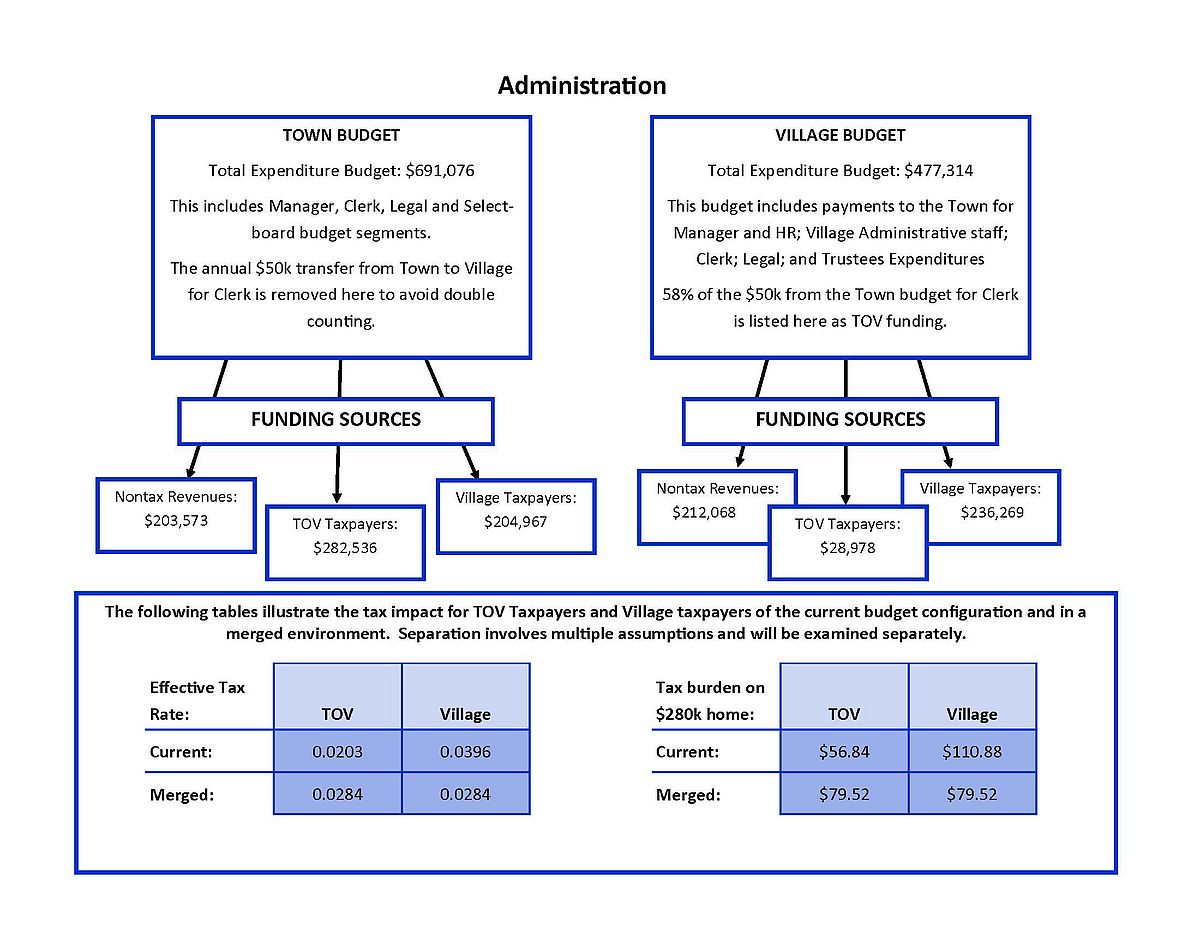
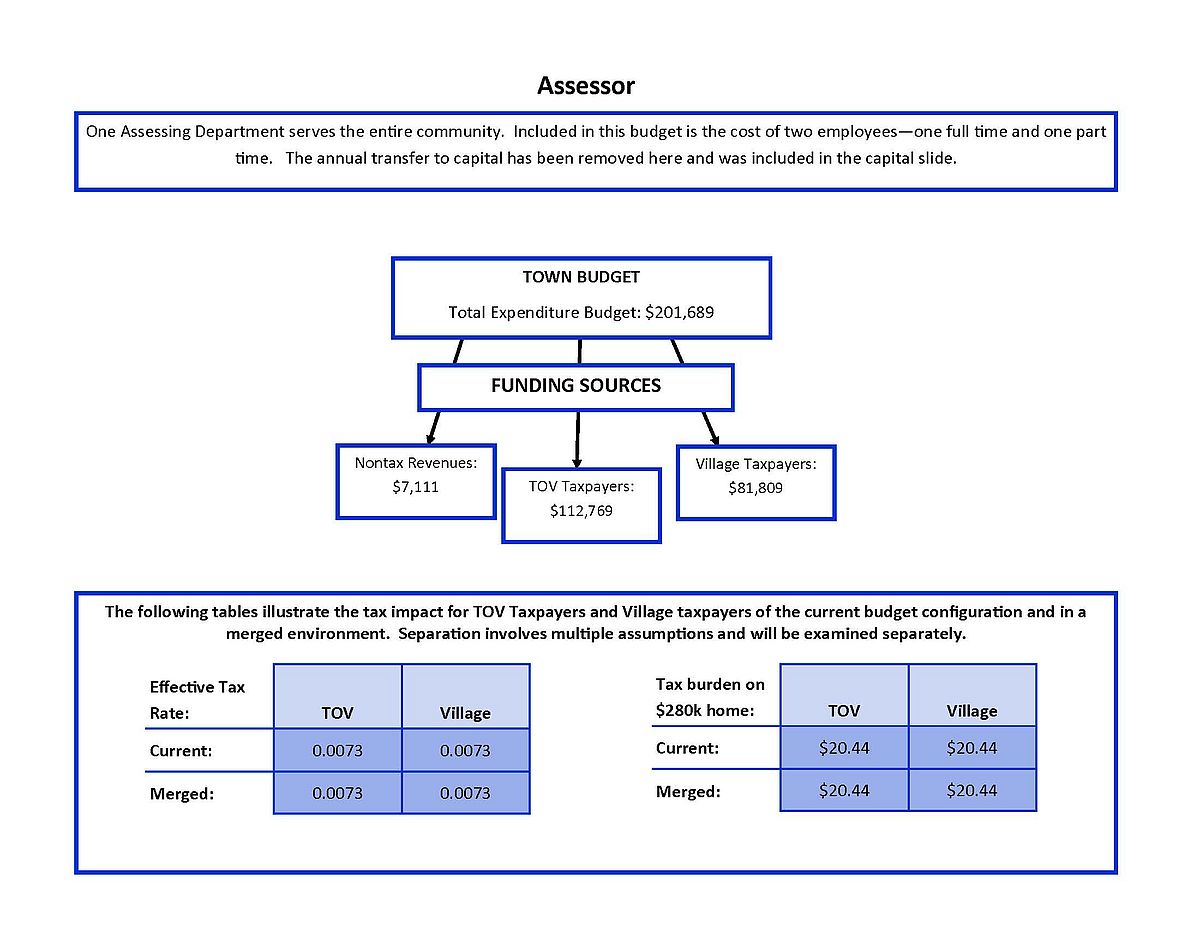
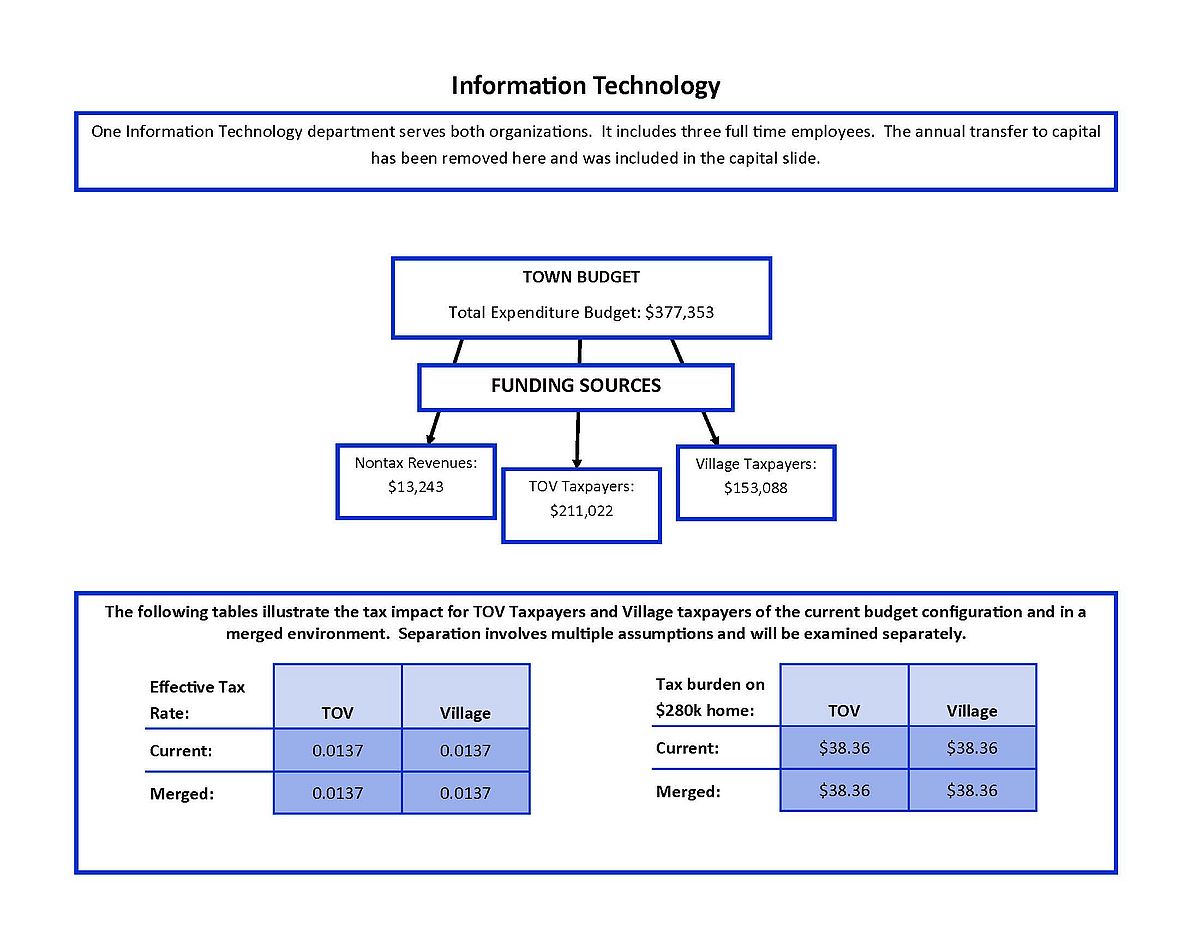
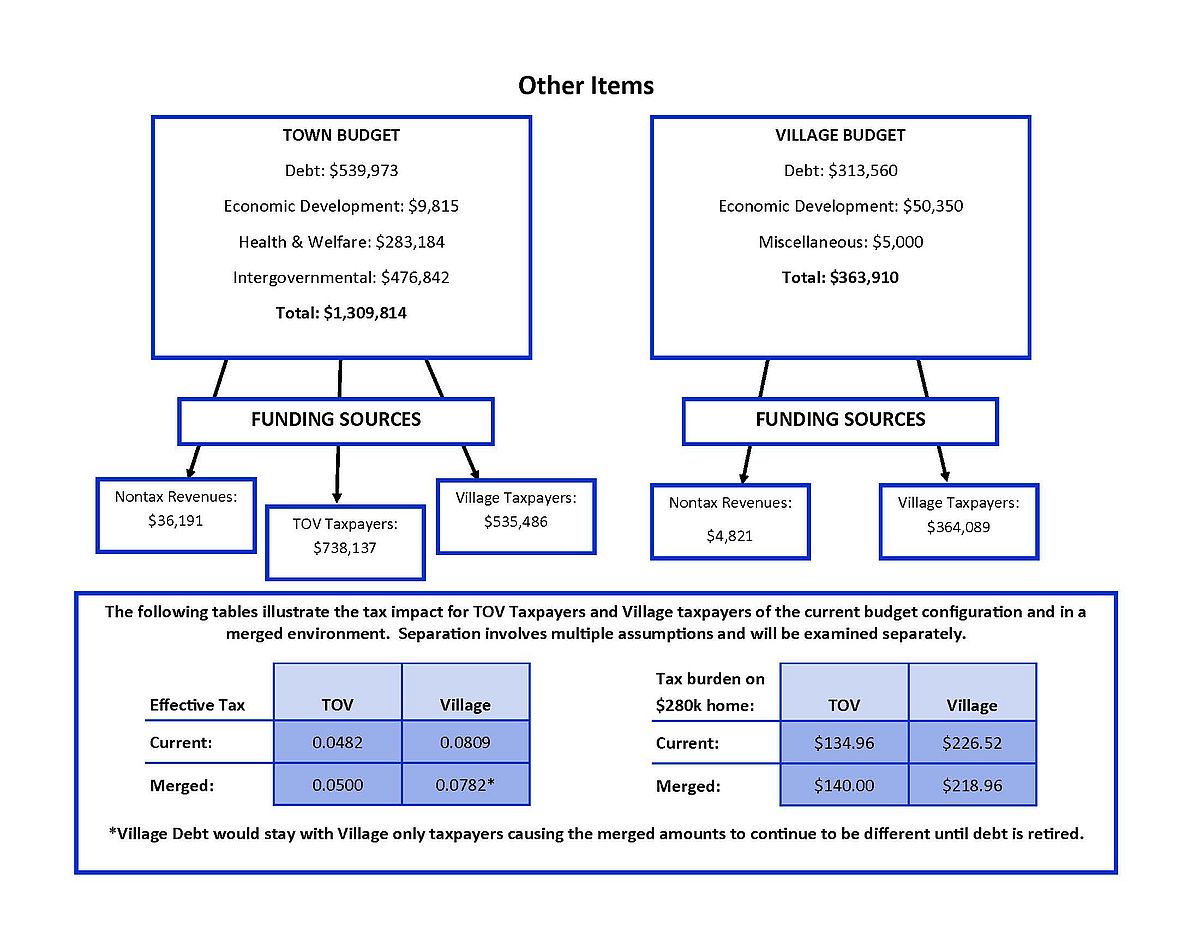
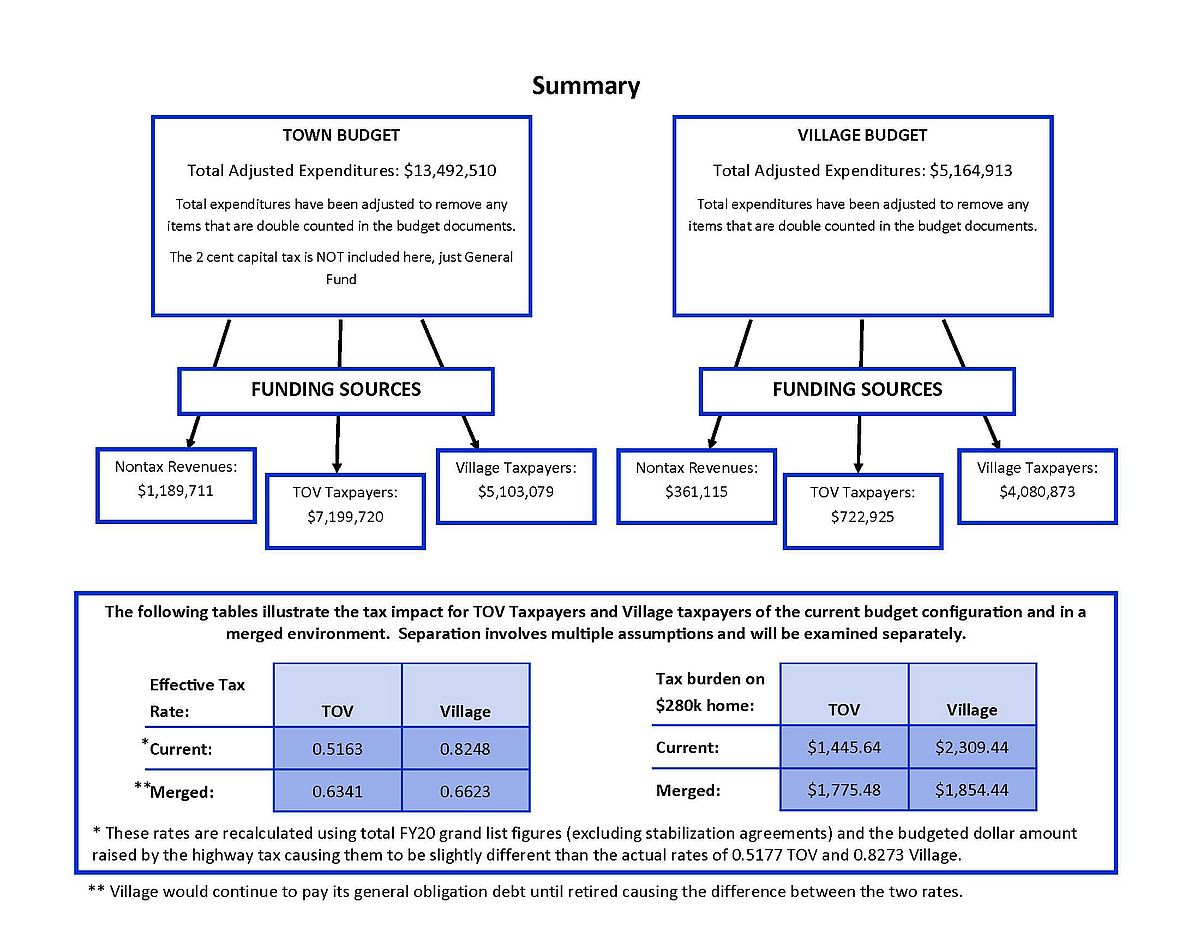
SEGMENT II: Departmental Comparisons (download PDF)
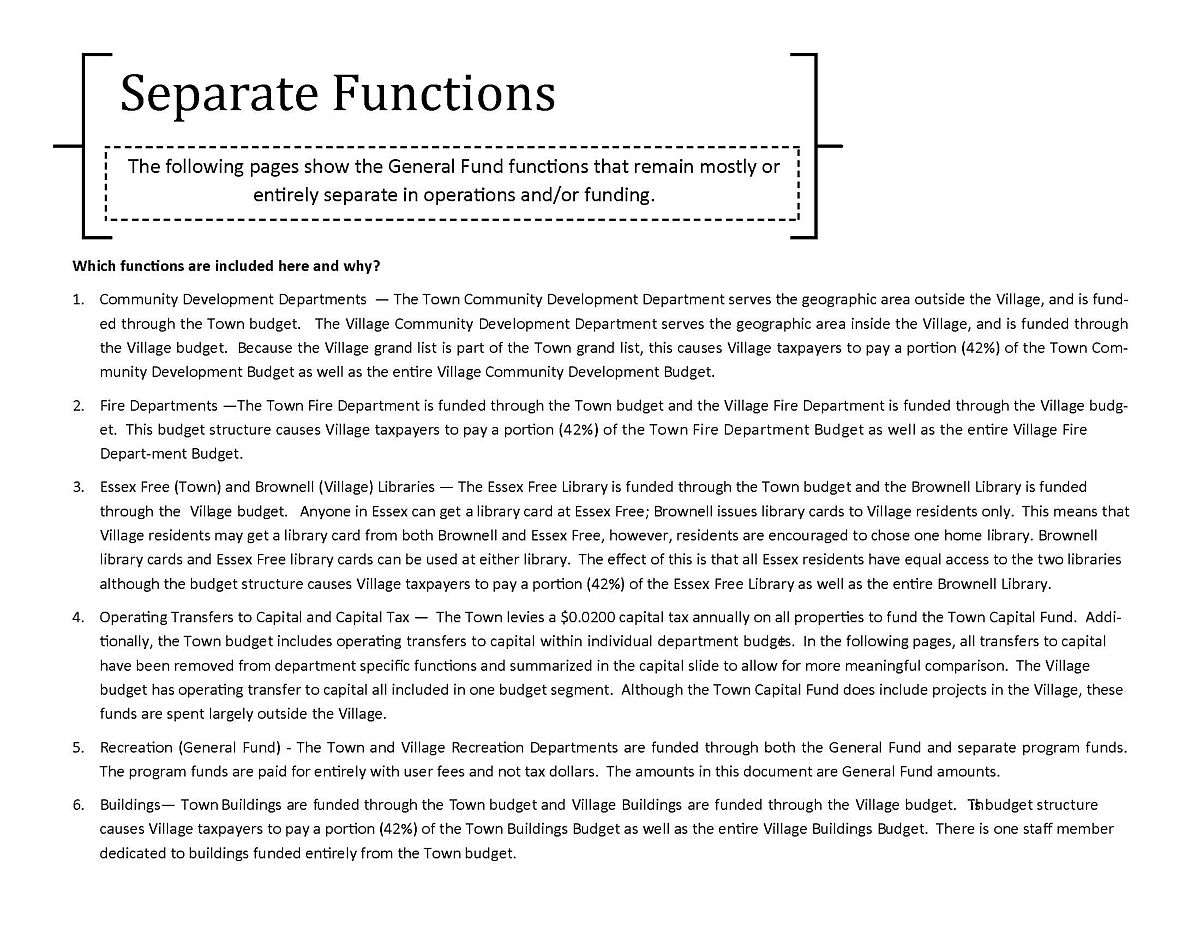
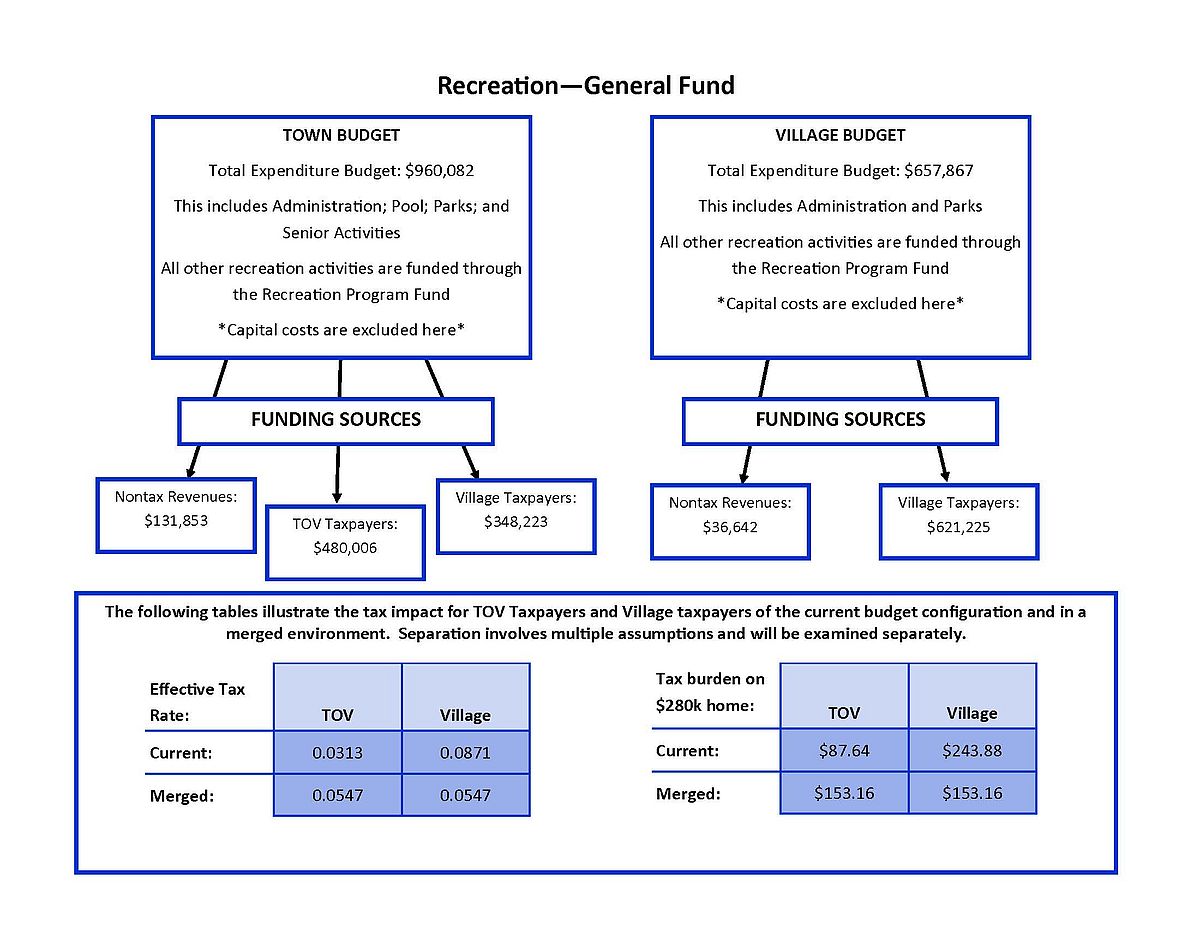
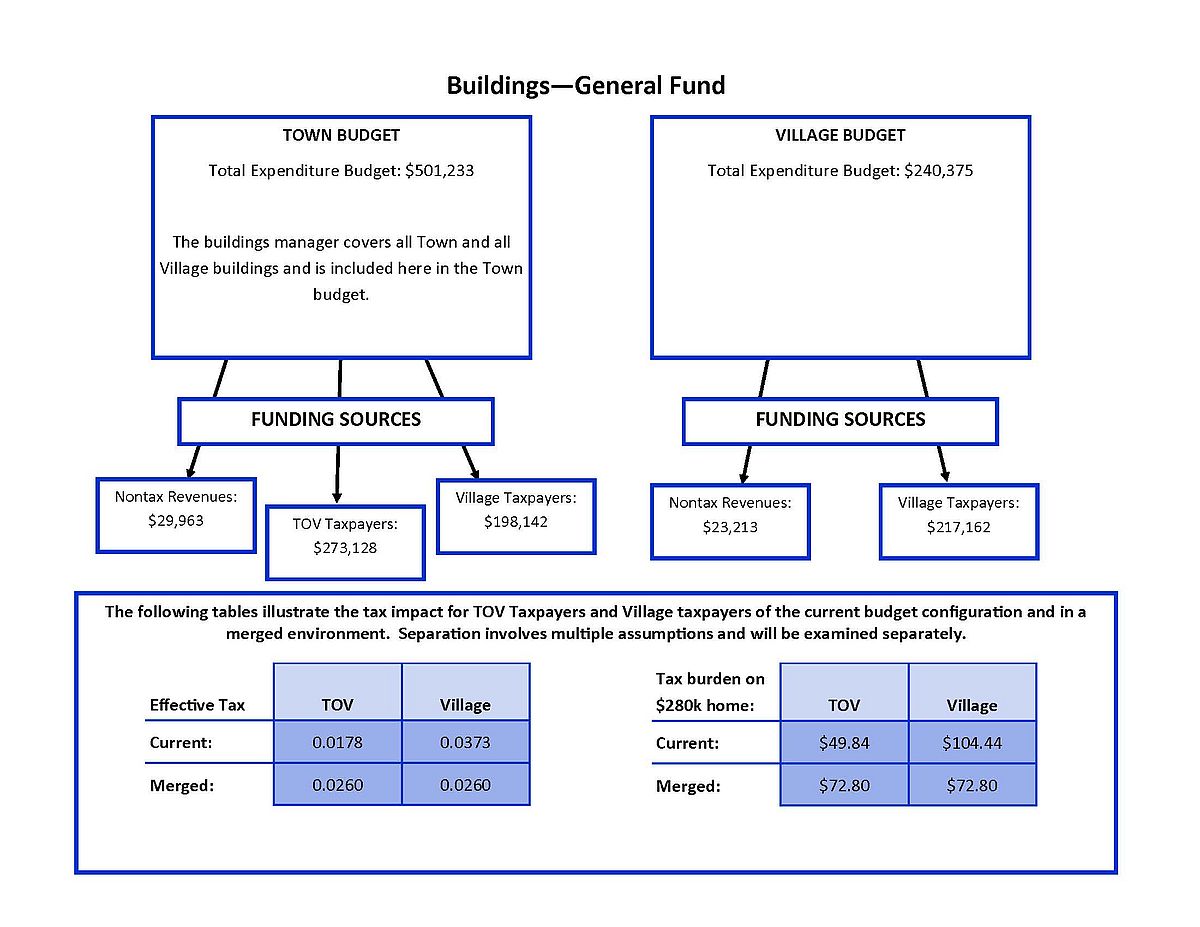
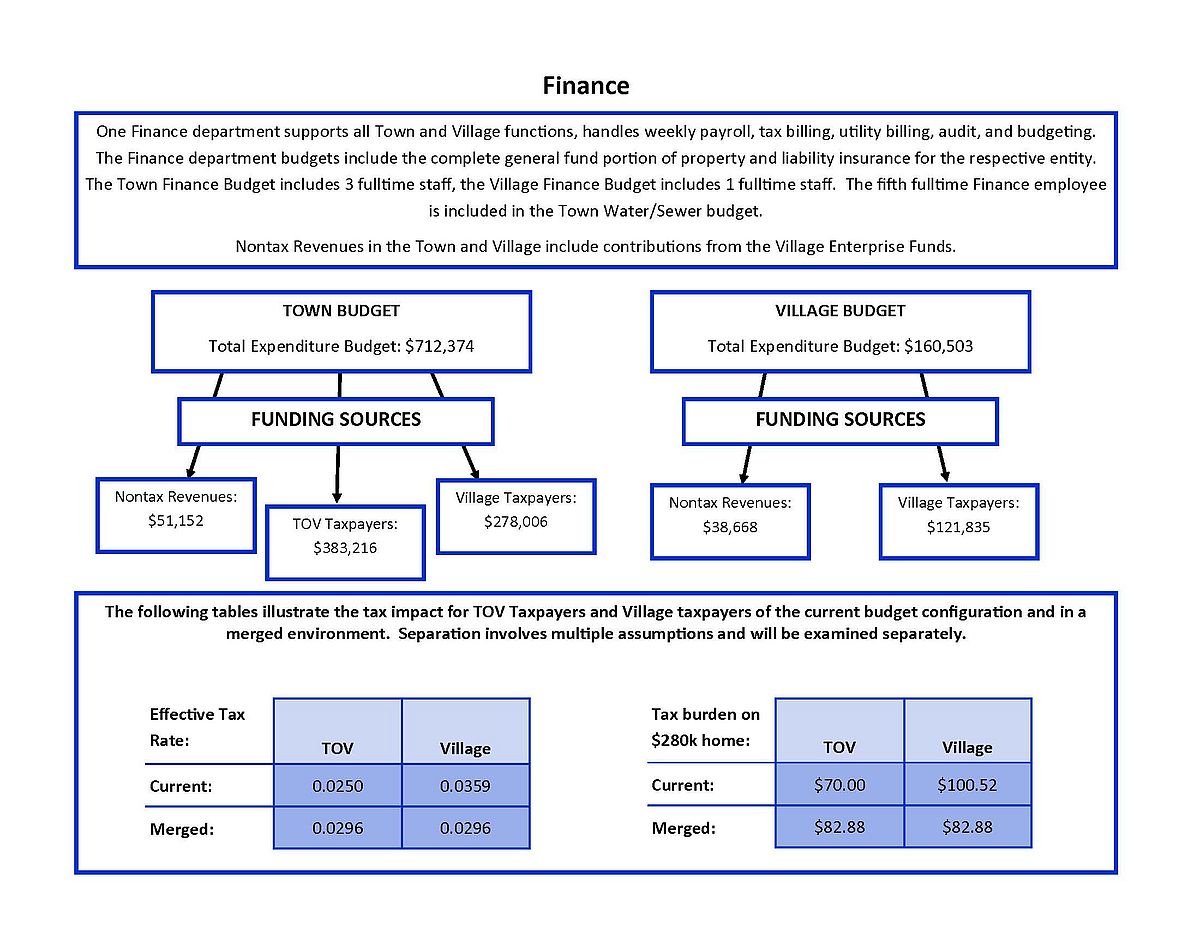
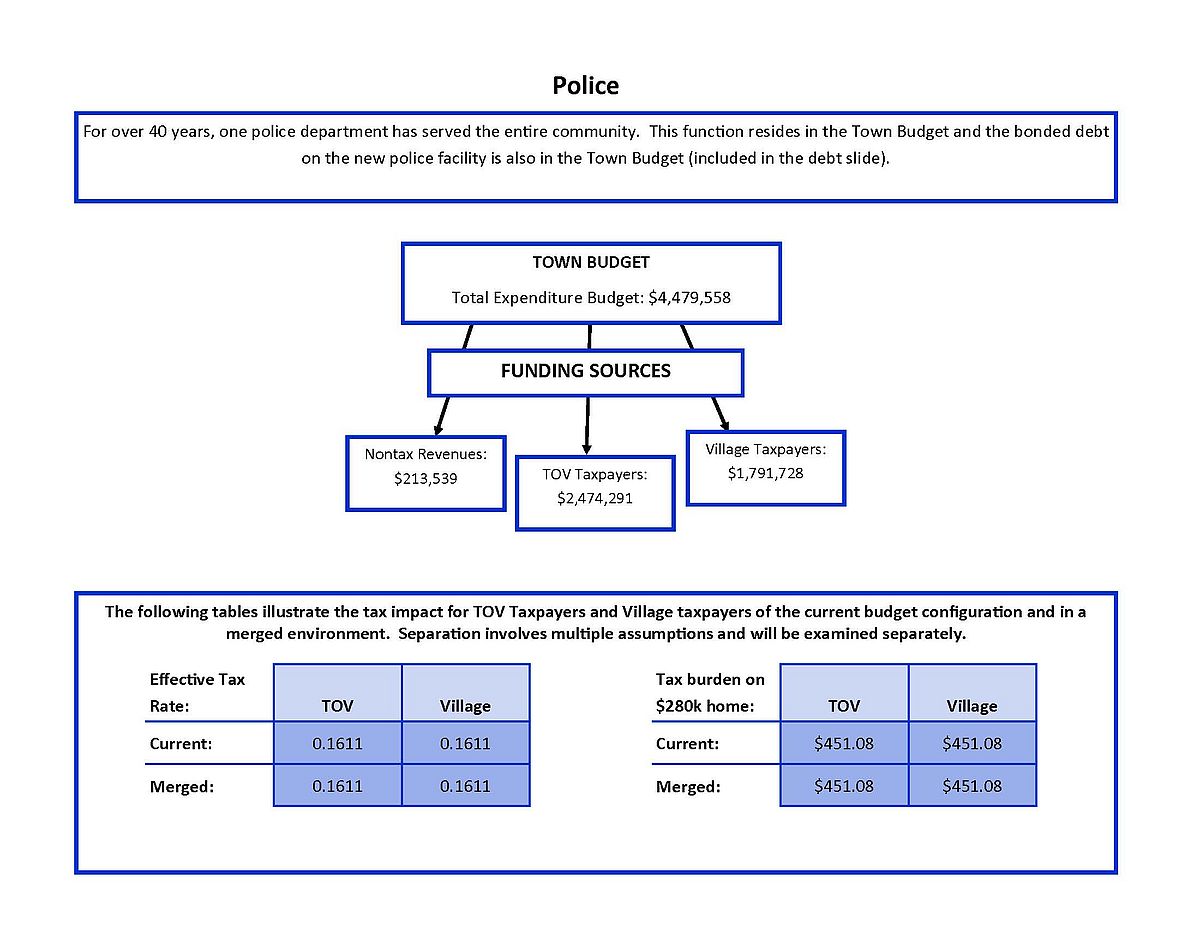
In segment II of this document, each budget segment as identified in segment I after the
reconciliation, is given its own page. The first part is for budget segments that function separately
in operations or financing. These are Community Development, Fire, Libraries, Capital,
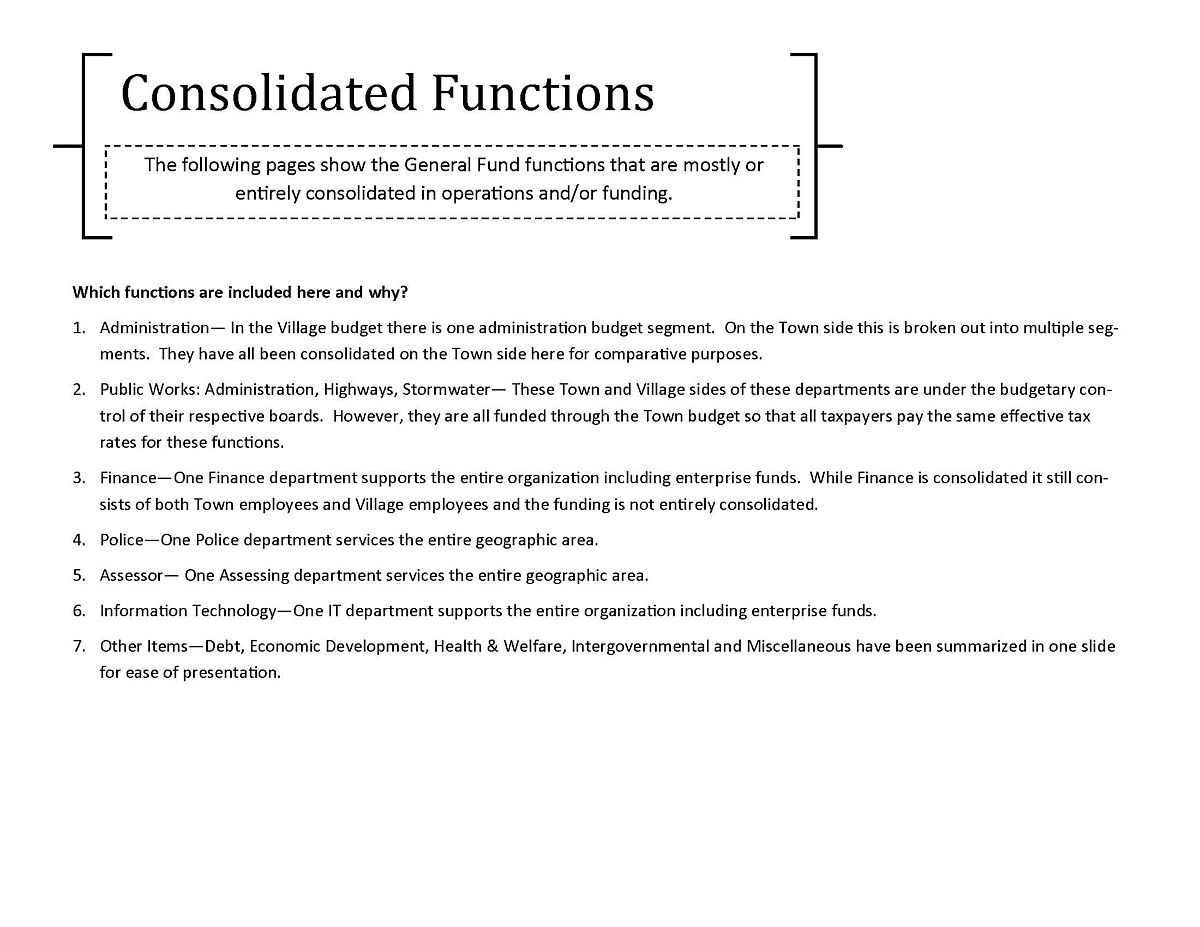
Recreation, and Buildings. The second part is for budget segments that are consolidated in
operations or funding and this includes Administration, Public Works, Finance, Police, Assessing,
Information Technology, and the “other” category which consolidates the left over items. The final
page of this segment summarizes the overall budgets.
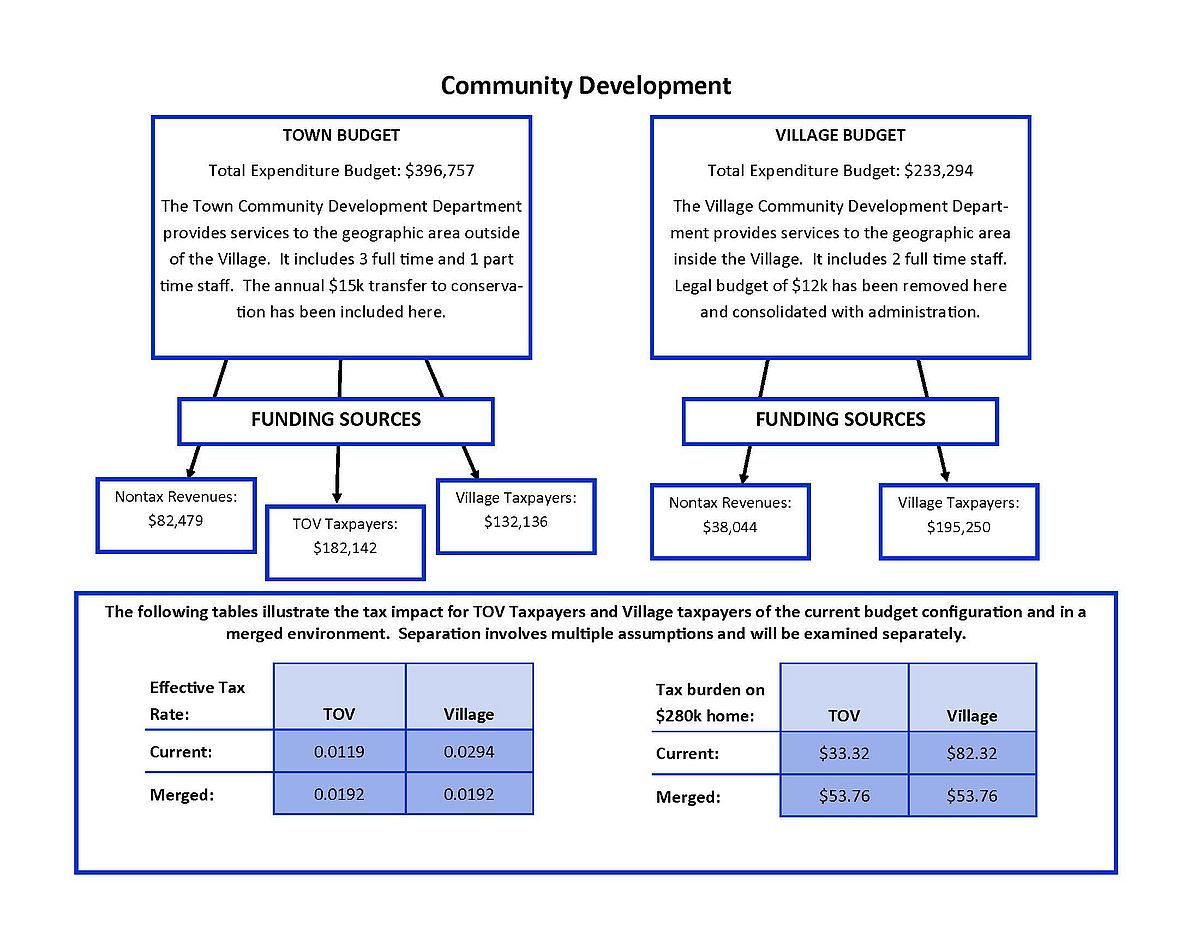
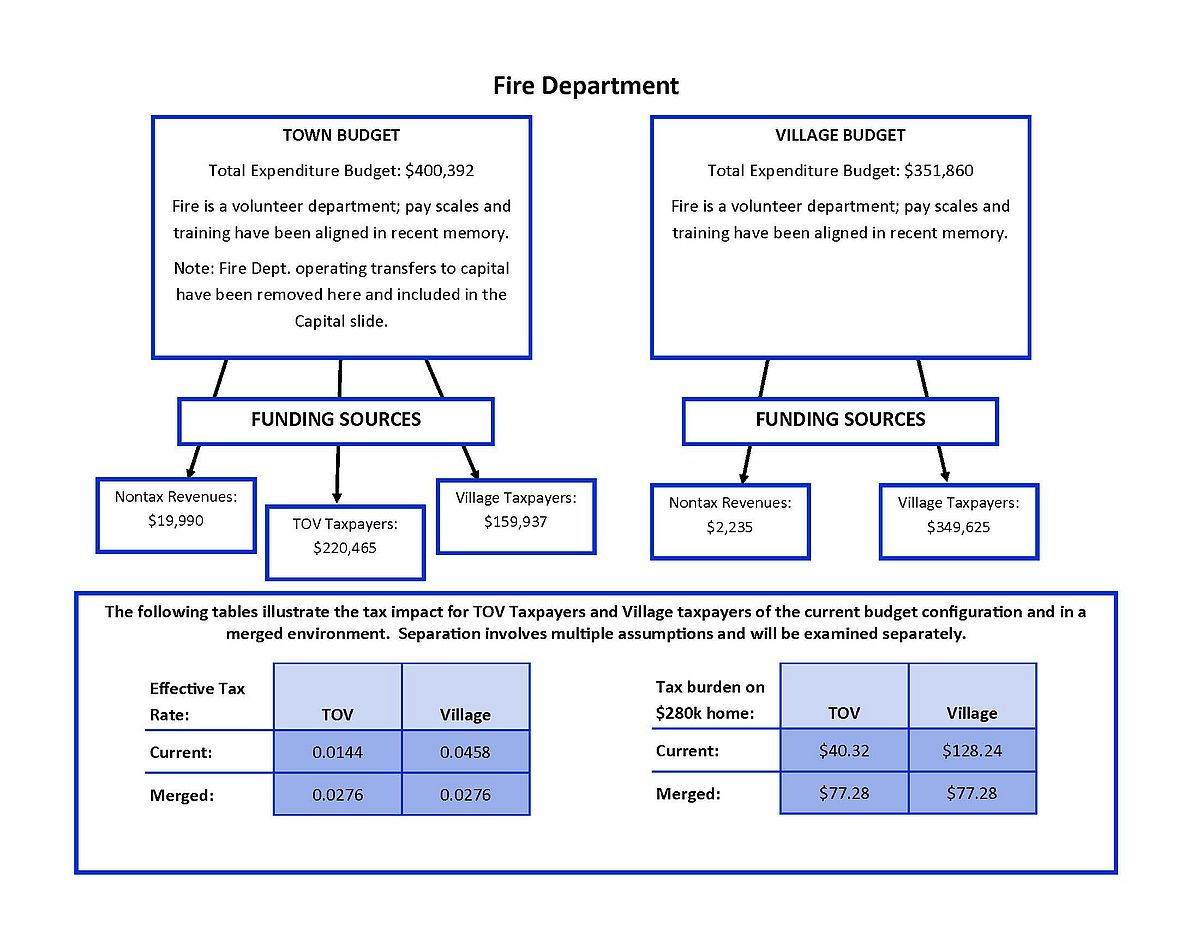
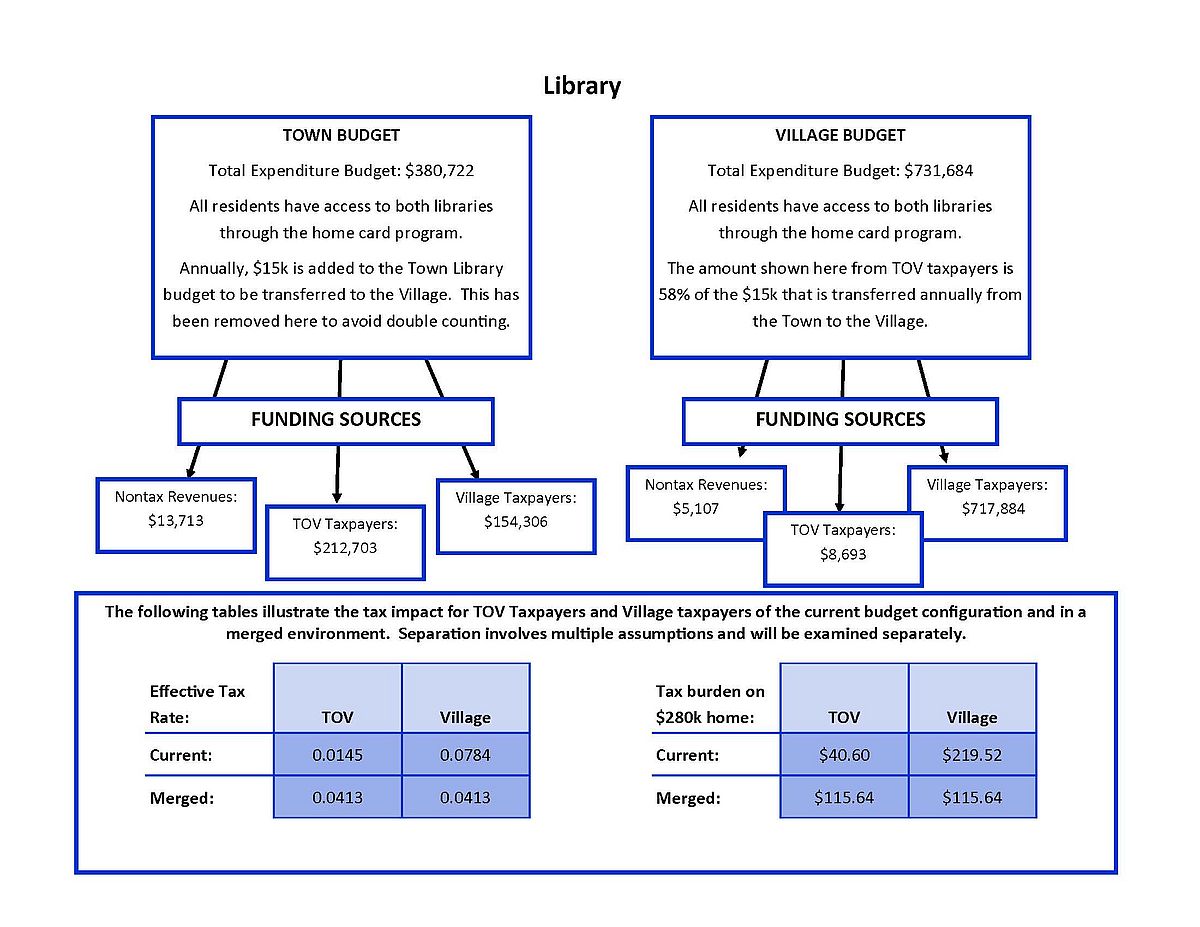
Each one page has a bit of narrative, shows the total budget, the funding sources broken out
between nontax revenues, TOV tax revenues, and Village tax revenues. It then translates this into
an effective tax rate in the current environment and what it would be in a merged environment and
it shows the tax burden on a $280,000 property in those two environments.
SEGMENT III: How to start thinking about the cost of separation? (download PDF)
Detailing the state of current budgets was complicated, analyzing what it would cost to separate
even more so. The first assumption is that the combined tax levy of the Town and Village is the
total amount of tax dollars required to provide governmental services to the whole of Essex. Why
is this? Current levels of service cover the entire geographic area and all residents and any overlap
or duplication of services to one group is driven by demand. Demand driven services (for example
3 recreation and libraries) would presumably continue to have the same level of demand regardless
of how they were funded. If all of those costs are combined and then divided equally back into
one single tax rate (merger scenario) the increase to TOV taxpayers and the decrease to Village
taxpayers is approximately 20% spread out over an agreed upon number of years (12).
In a separation scenario, the initial assumption should be the same – that the combined tax levy of
the Town and Village is the total amount of tax dollars required to provide governmental services
to the whole of Essex. The next assumption required is how will the total cost be divvied up
between the two segments? Is it a weighted calculation that factors in area, parcels, assessments,
and residents? Are different services costed back out with different assumptions? It all gets
complicated very quickly. So while it may not make the most sense across the board, I think we
would use grand list split as a starting point. This results in the same change in taxes for TOV and
Village taxpayers as the merged scenario – about 20% each. The primary difference is in a
separation scenario that change is all in the first year instead of spread over a negotiated time
frame.
Either of these two assumptions (total cost and how cost would be allocated) could take on
countless forms causing the cost of separation to vary widely. Finally, none of this factors in
growth projections. As the grand list grows at varying rates throughout the community, the tax
rate impact is diluted to the extent that grand list growth doesn’t require additional services.
The information included in the packet includes some description of each of the items identified
to help the reader understand and also to show how a range of factors and decisions changes the
numbers.
Final Thoughts.
There are inequities in the way government is funded in our current situation. Village taxpayers
are paying for services they are not eligible to receive, and are paying more for services that they
and TOV taxpayers have equal access to. This means that TOV taxpayers are paying less than the
true cost for some services. There are multiple ways to correct this – through merging, through
separating, or through other ways of determining which portion of the tax base pays for what in
the current situation. Each of these options has advantages and disadvantages and the numbers
are not going to show the best way forward. In order to determine which way to move forward
the question must be answered: What is our vision for the future of Essex as a municipality? From
there, the numbers will follow.
Important final disclaimer – there are many assumptions that went into preparing some of this
information and that is just a start. Each of those and many, many more would impact the actual
results. Again, nothing here factors in future grand list growth, future service demands, or the
differing average growth rates in different parts of town. It also does not address ownership of
land and other assets. This is a discussion piece, a model only. And as British statistician George
Box said in 1976 “all models are wrong, some are useful” – my work here is no exception.
Click graphic to enlarge

